> ## Documentation Index
> Fetch the complete documentation index at: https://docs.pinata.cloud/llms.txt
> Use this file to discover all available pages before exploring further.
# Logs
> Stream your agent engine's output in real time
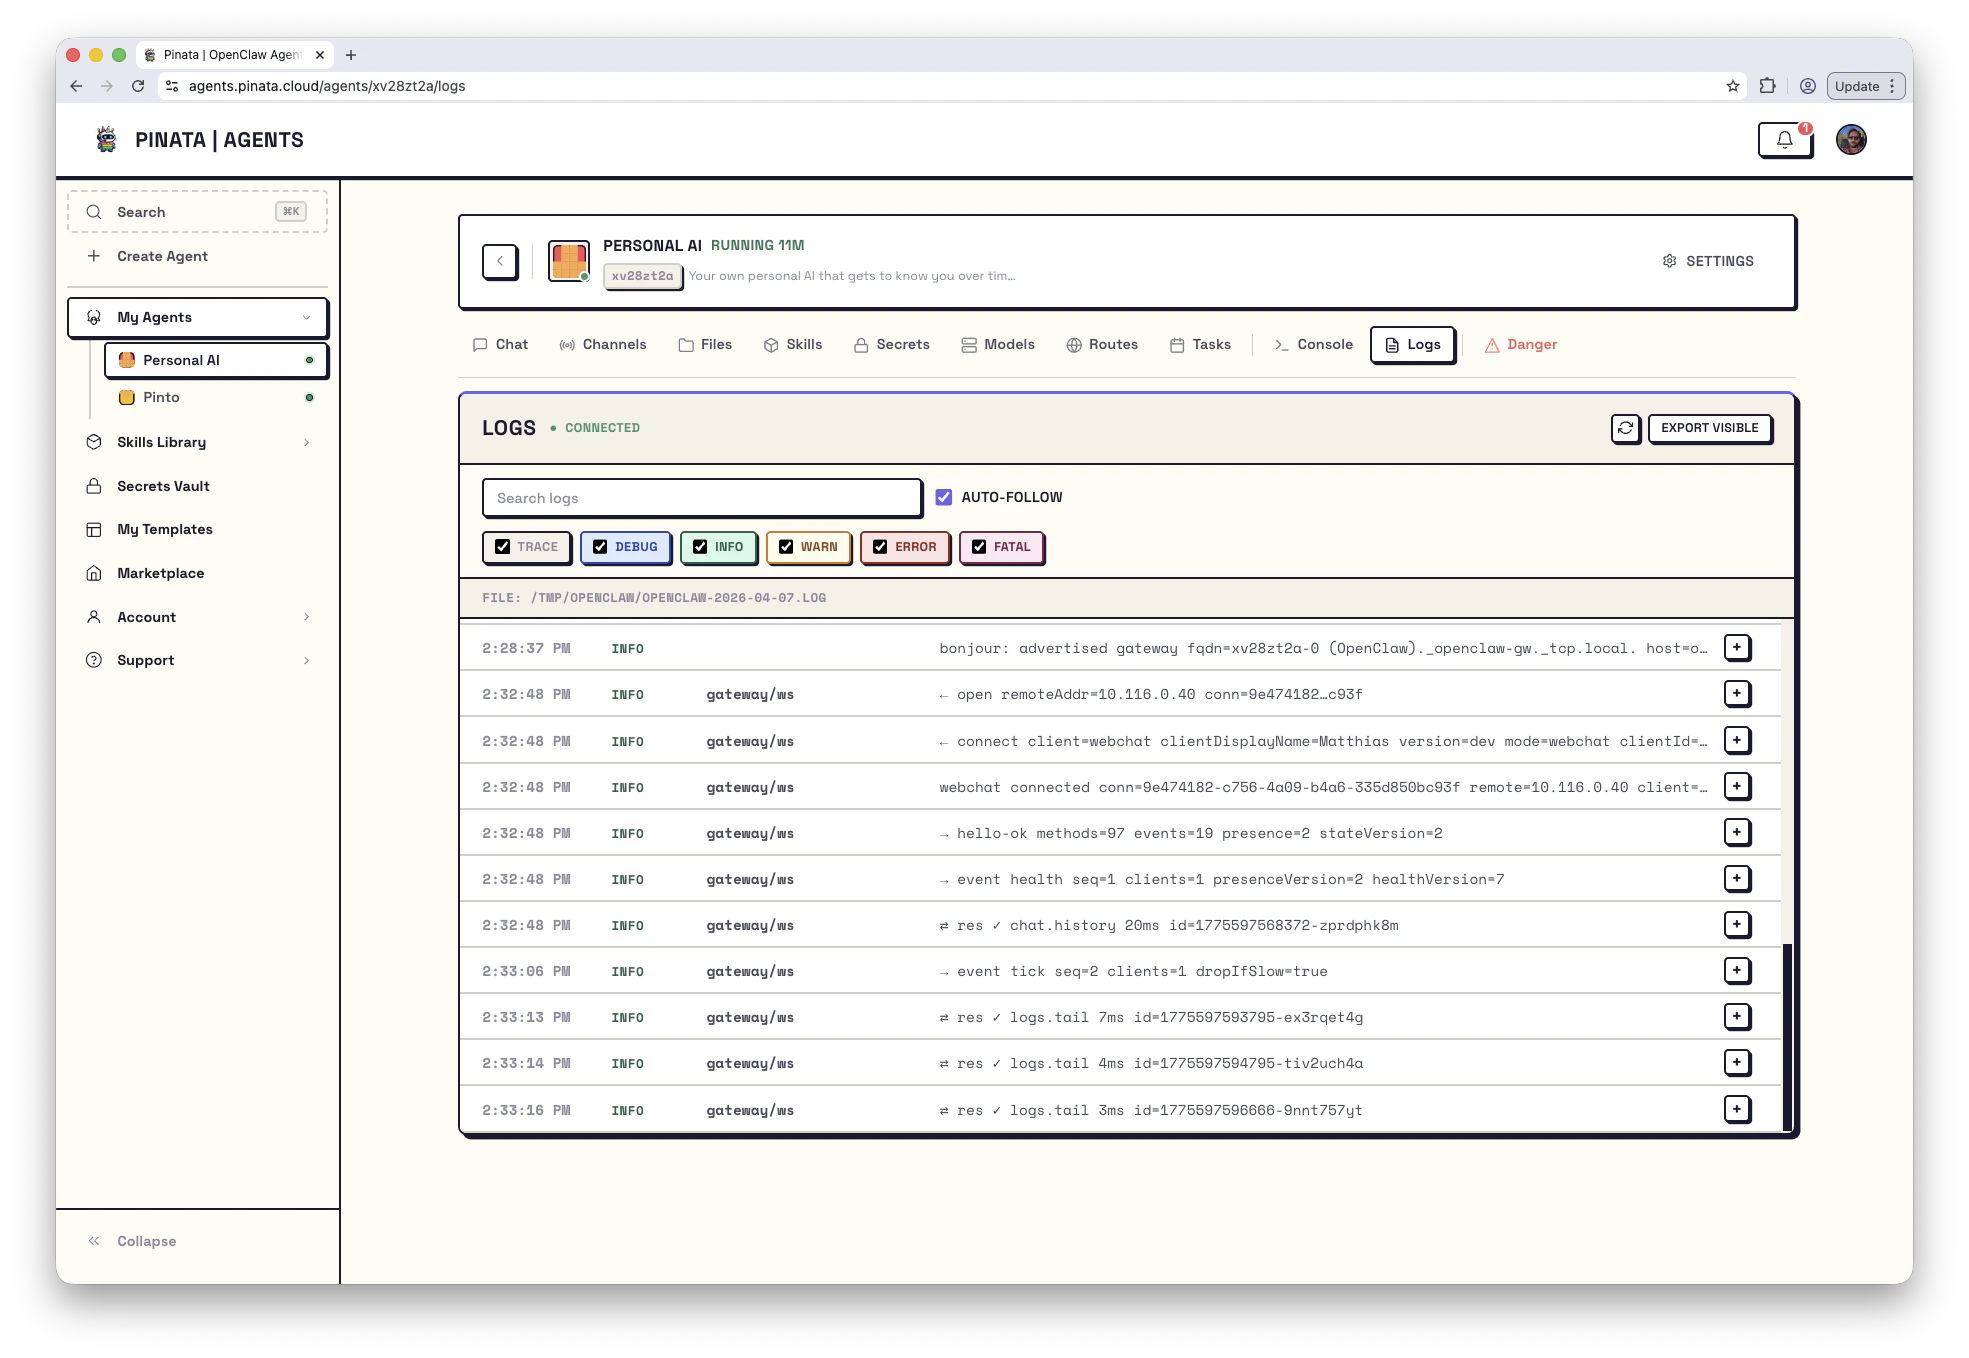
The Logs tab is a live stream of what the agent engine is doing inside your agent. New entries appear without refreshing — the tab uses a WebSocket under the hood. If the small status badge in the header reads **Connected**, you're streaming. If it reads **WebSocket not connected**, either the agent isn't running, the connection dropped, or there are no gateway log lines yet — hit the refresh button or check the agent's status.
 ## Reading the stream
Each log line has four parts:
* **Timestamp** — when it happened
* **Level** — severity (`TRACE`, `DEBUG`, `INFO`, `WARN`, `ERROR`, `FATAL`)
* **Source** — which component generated the line (e.g. `gateway/reload`, `cron/runner`)
* **Message** — the content
Click the **+** on the left of any row to expand it. Useful for stack traces and structured fields that don't fit on a single line.
## Filtering
The six colored checkboxes — TRACE, DEBUG, INFO, WARN, ERROR, FATAL — toggle log levels on and off. When you're hunting a problem, uncheck everything except WARN and above to cut the noise.
The **Search logs** box does a substring match against the message. Combine with level filters: "show me ERROR lines mentioning `telegram`."
The **AUTO-FOLLOW** checkbox keeps the view pinned to the latest entry. Uncheck it when you want to scroll back without the view jumping.
## Exporting
**EXPORT VISIBLE** downloads whatever the current filters are showing — useful for sharing with support or filing an issue. It's only what you see; the export respects your filters.
## Where the logs live on disk
Inside an OpenClaw container, daily log files live at `/tmp/openclaw/openclaw-{date}.log`. From the [Console](/agents/console):
```bash theme={null}
ls /tmp/openclaw/
tail -f /tmp/openclaw/openclaw-$(date +%Y-%m-%d).log
```
For other engines, use the Logs tab or the logs API as the stable interface; on-disk log paths are engine-specific. The API keeps the latest 100 lines when the gateway restarts. If you need long-term retention, export periodically.
## Reading logs over the API
For scripts and incident response:
```bash theme={null}
curl -H "Authorization: Bearer $PINATA_JWT" \
https://agents.pinata.cloud/v0/agents/$AGENT_ID/logs
```
Returns the latest 100 lines as a single string. For full streaming, the UI uses a WebSocket on the agent's subdomain — see [API → Streaming logs](/agents/api#streaming-logs).
## Common sources, and what they tell you
| Source | What it means |
| ------------------------------ | --------------------------------------------------------------------------------------- |
| `gateway/reload` | Gateway reloaded its configuration — usually after a secret, skill, or channel change |
| `gateway/ws` | WebSocket lifecycle (connect, disconnect, reconnect) |
| `cron/runner` | A scheduled task fired — which one, and what happened |
| `agent/turn` | One conversation turn — request in, response out |
| `skill/` | Output from a specific skill |
| `script/build`, `script/start` | Lifecycle script output (also tee'd to `/tmp/user-build.log` and `/tmp/user-start.log`) |
If something's broken, start at ERROR. If you see ERROR lines and can't make sense of them, [Troubleshooting](/agents/troubleshooting) maps symptoms to fixes, and the [Error reference](/agents/errors) covers common API error responses.
## Reading the stream
Each log line has four parts:
* **Timestamp** — when it happened
* **Level** — severity (`TRACE`, `DEBUG`, `INFO`, `WARN`, `ERROR`, `FATAL`)
* **Source** — which component generated the line (e.g. `gateway/reload`, `cron/runner`)
* **Message** — the content
Click the **+** on the left of any row to expand it. Useful for stack traces and structured fields that don't fit on a single line.
## Filtering
The six colored checkboxes — TRACE, DEBUG, INFO, WARN, ERROR, FATAL — toggle log levels on and off. When you're hunting a problem, uncheck everything except WARN and above to cut the noise.
The **Search logs** box does a substring match against the message. Combine with level filters: "show me ERROR lines mentioning `telegram`."
The **AUTO-FOLLOW** checkbox keeps the view pinned to the latest entry. Uncheck it when you want to scroll back without the view jumping.
## Exporting
**EXPORT VISIBLE** downloads whatever the current filters are showing — useful for sharing with support or filing an issue. It's only what you see; the export respects your filters.
## Where the logs live on disk
Inside an OpenClaw container, daily log files live at `/tmp/openclaw/openclaw-{date}.log`. From the [Console](/agents/console):
```bash theme={null}
ls /tmp/openclaw/
tail -f /tmp/openclaw/openclaw-$(date +%Y-%m-%d).log
```
For other engines, use the Logs tab or the logs API as the stable interface; on-disk log paths are engine-specific. The API keeps the latest 100 lines when the gateway restarts. If you need long-term retention, export periodically.
## Reading logs over the API
For scripts and incident response:
```bash theme={null}
curl -H "Authorization: Bearer $PINATA_JWT" \
https://agents.pinata.cloud/v0/agents/$AGENT_ID/logs
```
Returns the latest 100 lines as a single string. For full streaming, the UI uses a WebSocket on the agent's subdomain — see [API → Streaming logs](/agents/api#streaming-logs).
## Common sources, and what they tell you
| Source | What it means |
| ------------------------------ | --------------------------------------------------------------------------------------- |
| `gateway/reload` | Gateway reloaded its configuration — usually after a secret, skill, or channel change |
| `gateway/ws` | WebSocket lifecycle (connect, disconnect, reconnect) |
| `cron/runner` | A scheduled task fired — which one, and what happened |
| `agent/turn` | One conversation turn — request in, response out |
| `skill/` | Output from a specific skill |
| `script/build`, `script/start` | Lifecycle script output (also tee'd to `/tmp/user-build.log` and `/tmp/user-start.log`) |
If something's broken, start at ERROR. If you see ERROR lines and can't make sense of them, [Troubleshooting](/agents/troubleshooting) maps symptoms to fixes, and the [Error reference](/agents/errors) covers common API error responses.